A recent UBS study revealed that, over a 10-year period, a portfolio of investments in "top performers" on environmental, social and governance (ESG) aspects achieved results 30% higher than a portfolio of investments in "low performers" (= an additional annual return of 1.6%). This UBS study highlights the growing importance of integrating sustainable practices across all ESG domains, including the one that concerns us: the restoration of ecosystems and biodiversity.
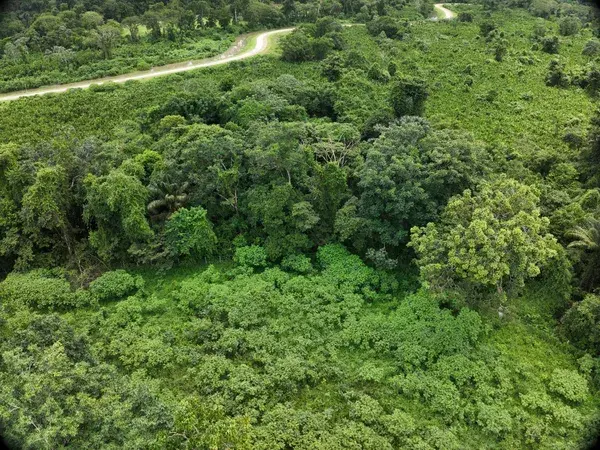
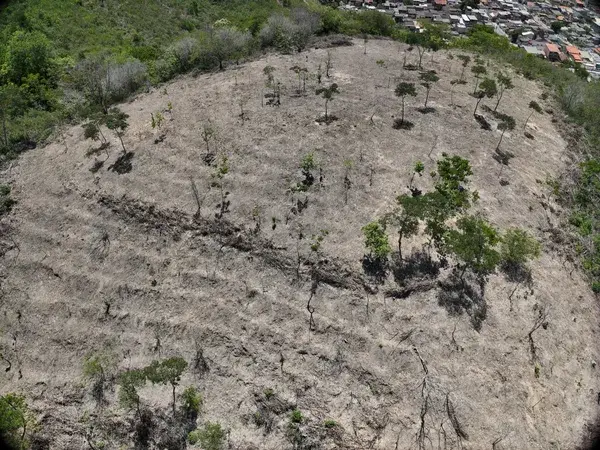
Forest ecosystem restoration has become a major tool in the palette of environmental and social solutions. This approach, involving the planting of trees and the restoration of degraded areas, is a major response to current challenges. McKinsey, in its recent analysis of 31 solutions for mitigating climate change, identified forest ecosystem restoration as one of the most mature and adopted solutions on the subject.
First and foremost: follow a few best practices when setting up your projects
After this brief introduction, let's move on to the projects themselves. The aim of this article is not simply to convince you of the importance of reforestation in the context of climate change. What's more important is to understand how to integrate reforestation into your ESG strategy in a concrete way, giving it meaning and ensuring that you determine the indicators that will make your restoration strategy one that is adapted to the needs of the restored ecosystems, and enabling you to communicate calmly about your actions and commitments.
Before defining the key indicators and undertaking a reforestation project, we recommend that you follow (at least) these next five best practices.
- Ensure that the species planted will contribute to biodiversity
Ensure a variety of species to promote biodiversity and prevent environmental problems, and opt for species adapted to the local environment to reconstitute the ecosystem.
- Knowledge of the local ecosystem
Select local species useful for reconstituting the local ecosystem and seek partnerships with laboratories and universities to broaden knowledge.
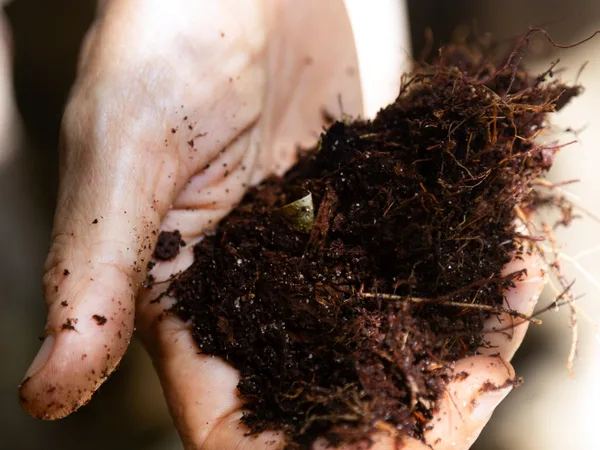
- Check that a precise soil analysis is carried out before planting.
Carry out soil analyses to determine the specific needs of the plantation and use the data to define a planting plan adapted to the terrain.
- Ensure that the project continues to be monitored, even after planting.
Maintain regular monitoring of the project to assess its success and use technology such as satellite surveillance or field teams for accurate tracking.
- Engaging stakeholders and integrating local communities
Collaborate with local communities for a participatory approach and promote the inclusion of local stakeholders in the reforestation process.
Choosing the right ESG indicators for a forest ecosystem restoration project
It is essential to choose relevant and meaningful indicators to effectively evaluate the effectiveness of any reforestation project. There is a pressing need for more comprehensive and informative indicators to measure the success and quality of these initiatives. It is crucial to shift from a quantity-based approach to one that emphasizes quality, implying a change of perspective, where the objective is not just to plant trees, but to restore ecosystems.

How do you define good indicators?
- Emphasis must be placed on balancing the structure and function of the trees planted, thus promoting genuine ecological restoration.
- These must include the entire ecosystem, combining social, environmental (soil, water, nature) and biodiversity aspects.
- To be engaging and easy to communicate, these indicators must be understandable to all.
These criteria can lead to the use of different indicators, more or less complex, which correspond to the level of maturity of your CSR strategy. To make communication easier, we suggest using two levels of indicators:
Level 1 indicators: These are simple but powerful indicators that can be easily communicated and understood by a wide audience. They include :
- The overall reforestation objective ;
- The number of species introduced ;
- The hectares to be restored ;
- Specific species planted.
Level 2 indicators: More complex, these indicators offer an in-depth understanding of project quality. They include :
- Post-plant tree diversity ;
- Soil quality index ;
- Biodiversity index ;
- The regeneration trajectory in relation to a reference or natural zone.
While recognizing the need for simple indicators for communication purposes, it is essential to use additional, more detailed metrics to gain a comprehensive understanding of the success of the restoration project.
Final word of advice: anticipate your data recovery method
Defining the right indicators is all well and good in theory, but in practice, you need to collect the data. Collecting and sharing data is indeed a crucial aspect of enhancing the effectiveness of your reforestation project. However, even the most relevant data loses its value if it is complex or incomplete to collect.
Today, advanced technology can make this task much easier. At MORFO, we use a dashboard that provides an instant, detailed view of all the data relating to your reforestation projects. This visual and accessible presentation gives you efficient data retrieval for clear communication with your team, your partners or for your ESG report.
-min%2520(2).png)
MORFO is a complete large-scale forest ecosystem restoration solution combining drone technology, computer vision and forest engineering. We accompany our forest restoration projects hand-in-hand with our customers, offering them a central role in their follow-up.
Thanks to our comprehensive dashboard, it is possible to access the diagnoses carried out by our teams in the field before, during and after our operations on a single platform. Images, maps and key figures make it easy to see how projects are progressing. Project progress and data are visible and directly downloadable via the dashboard.
Collaborate with MORFO and restore your operations: test our dashboard.