This year, a rare El Niño is forming. What does it change in Brazil?

Built on 44 years of data and 100,000 simulated seasons.

By MORFO, specialists in data for forest restoration.

Why this study

Brazil's federal El Niño panel and NOAA, the United States ocean and atmosphere agency, both expect a very strong El Niño this season. That changes the next planting season, and restoration strategies with it. We ran our analysis across the whole country and share it with everyone who plants in Brazil.

“The climate will never be what it was. Why should the way we plant stay the same?”
Grégory MaitreGM Brasil

Important

This weather analysis, on its own, is not enough to decide what to plant and how.

Climate is one of the 21 sources our models use. To really decide, the other 20 count too.

  • Climate series
  • Vegetation series
  • Fire
  • Land use
  • Slope
  • Deforestation
  • Actual cover
  • Natural regeneration
  • Orthophoto
  • Accessibility
  • Invasive species
  • Soil sampling
  • Species
  • Hypothesis validation
What this analysis does not say

Our scenarios are ranges built on 44 years of records. Here is what they do not cover:

  1. El Niño is not the only climate driver. The tropical Atlantic weighs heavily on the Northeast and the northern Amazon, and it is not part of this calculation.
  2. CHIRPS is a satellite estimate. In rugged terrain, actual rain can vary a lot within a few kilometres.
  3. NOAA indices come out two to three months late. This page uses the data available on 2026-09-25.
  4. These are scenarios for a region, not a forecast for a property.
  5. The field reports come from a voluntary consultation (19 responses, 74% from Pará). They describe what respondents observe or expect; they are not measurements.
Part 1 of 3

The methodology

Something unusual is happening in the Pacific. To understand what it means for Brazil, we read it against 44 years of data.


“What happens in the Pacific reaches Brazil weeks to months later. That lag is why we look there first: it gives us indications, not certainties.”
Jérémy GiralMORFO technical team
Part 2 of 3

What to expect for Brazil

With NOAA's odds and our 44 years of records, we simulated the coming season 100,000 times.Here is what comes out for Brazil, over each place's five wettest months, with the heart of the season between December and February.


“One degree more, you barely feel it as a person. But for a young planting, it changes the whole plan: irrigation, maintenance, costs.”
Rebecca Montemagni AlmeidaMORFO technical team

First change: the heat.

Second change: how much it rains.

Third change: when the rain comes.

In most places the season does not disappear: its window moves. A plan has to absorb that movement.

Tap any point on the map to see its history.

Part 3 of 3

What El Niño changes for restoration plans

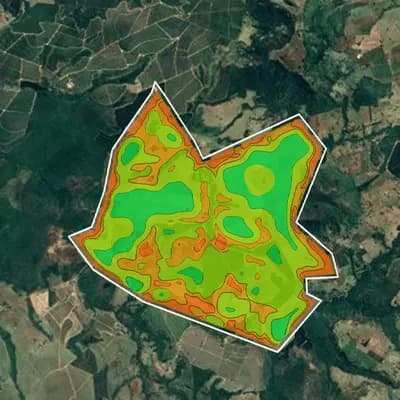
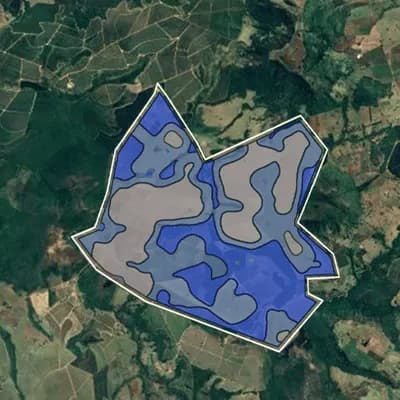
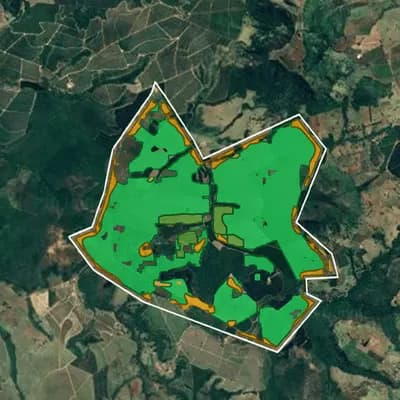
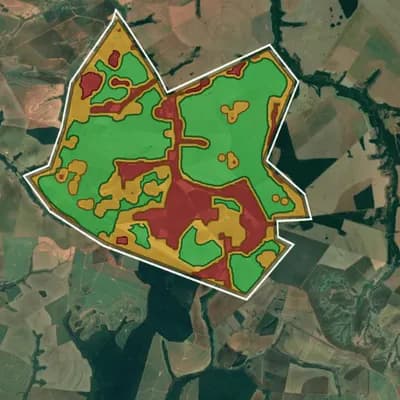
A map says where. On a planting, the questions are when, what, and at what cost.


“The planting window, soil preparation, ground cover, the species chosen and the care after planting must respond to the conditions of that territory and that year.”
Viviane Figueiredo, landscape restoration manager for the Amazon, Conservação Internacional BrasilInterview with Conservação Internacional Brasil, 17 September 2026Read the interview

Marabá is only a simplified example. In practice, we adapt many parts of a plan, among them:

  1. 1

    Species

    For the climate ahead. About 60 species modelled.

  2. 2

    Seed collection

    Follows the flowering, which moves.

  3. 3

    Planting window

    Read in the data, not in the calendar.

  4. 4

    Soil preparation

    Timed on the new date.

  5. 5

    Seedlings

    Ready for the new date.

  6. 6

    Watering and hydrogel

    For the dry spells after planting.

  7. 7

    Monitoring

    Field, satellite, drones: a loss seen in time.

  8. 8

    Replanting and care

    Planned from the start, with their cost.

  9. 9

    Fire

    Its risk runs through the whole chain.

Each plan has its own list, and we go through it with you.

MORFO Ri plans each of these, plot by plot.

See MORFO Ri

We could go on for hours and show hundreds more charts. But the planting season is starting.

We have four last things to share with you.

  1. 1MORFO Ri
  2. 2A projection for your location
  3. 3How to get a deeper analysis
  4. 4How to get more graphs
1

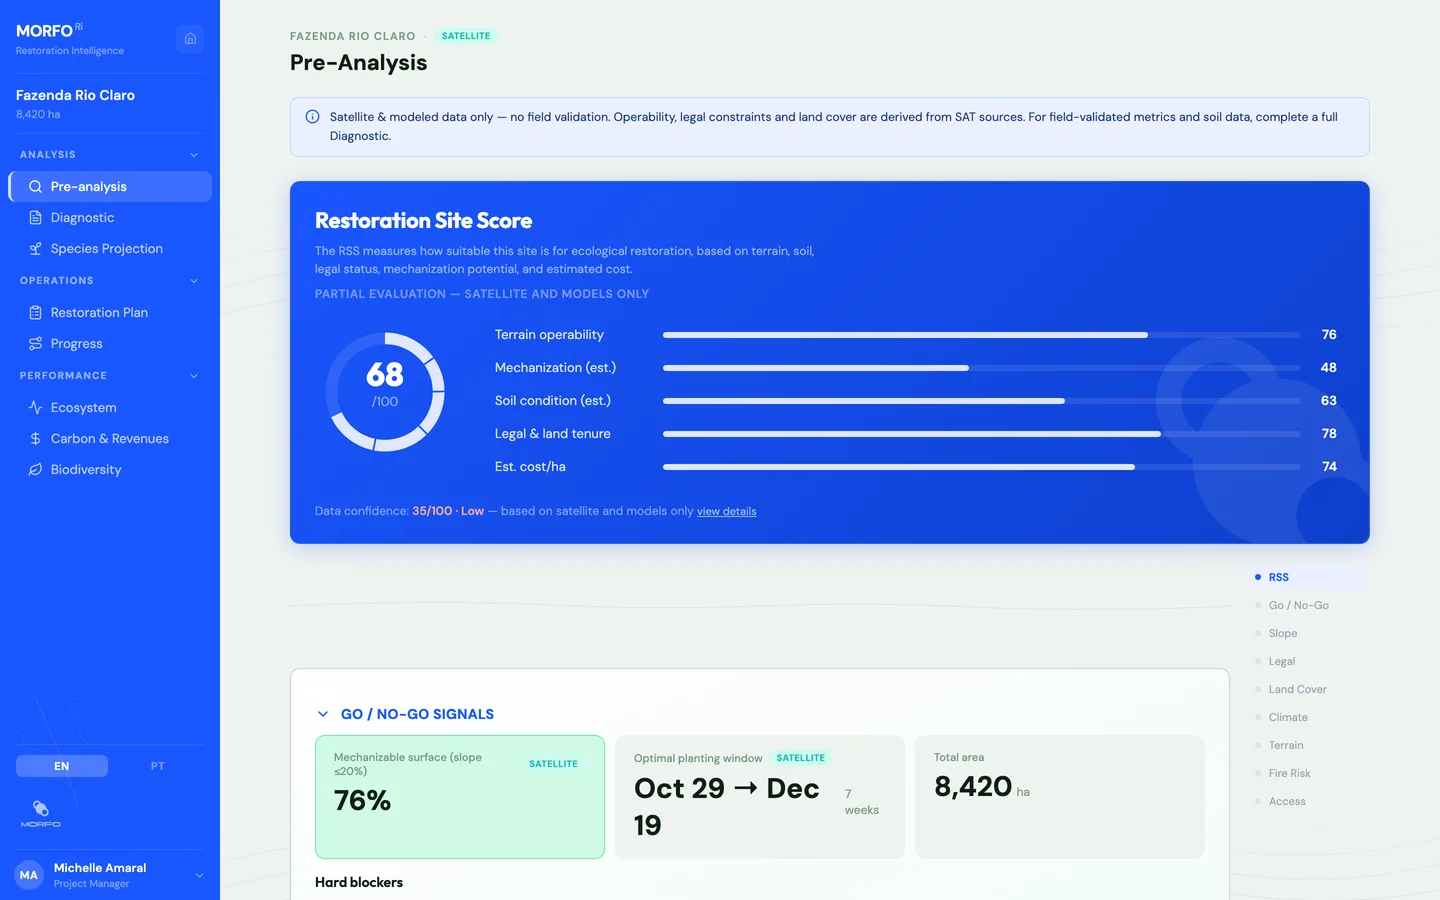
The study you saw today is an extract of what our platform reads, plot by plot, before each plan.

This weather analysis is one of the 21 sources our models use. Only one: to really decide, the other 20 count too.

  • Land use
  • Soil cover
  • Slope
  • Biodiversity
  • Mechanisation
  • Planting strategy
  • Vegetation control
  • Legal constraints
  • And much more

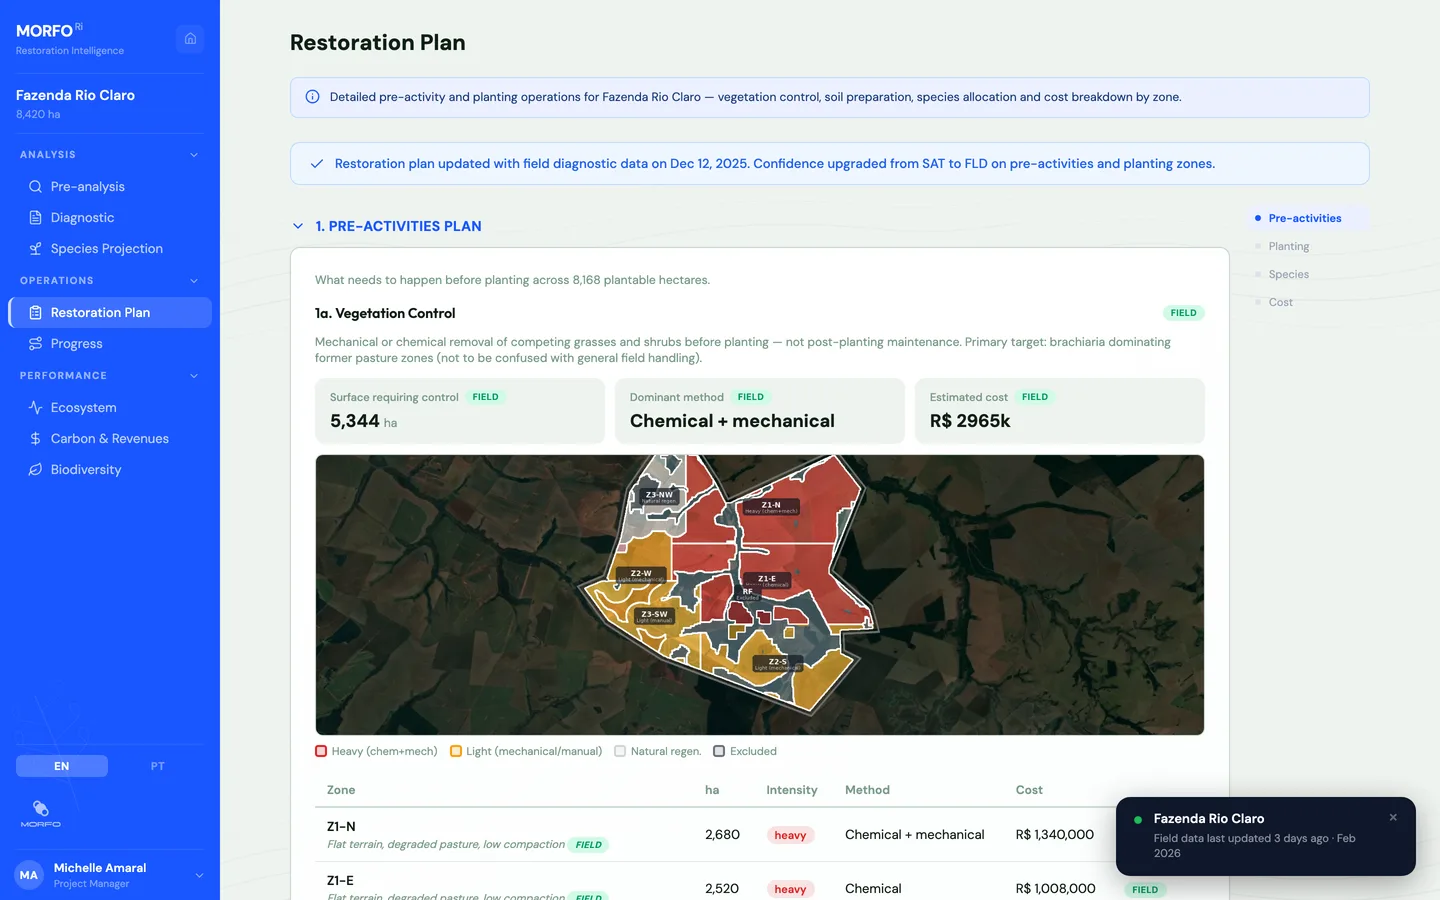
MORFO Ri tells you, plot by plot, which operations are needed and what they cost.

Satellite, soil, slope, roads, water and fire read together, plot by plot, including what bids usually miss: slopes too steep for machines, road wear, hours to the nearest clinic.

Discover MORFO Ri
2

If you wish, you can run a short projection for your own location.

Interactive tool

Run a projection for your location

Or tap the map

Click on your location on the map

Get in touch with the team Send us a message

3

For a deeper analysis of your own area, get in touch with the team.

Contact the team

Native forest restoration needs the most advanced tools.

Thank you for reading.

Share on LinkedIn

Sources

Updated on 2026-09-25MORFO technical team

In the north and centre, El Niño seasons fall on the dry side: 12 of 15 since 1981 were below average, including 1997-98 and 2015-16.

In the south, the strongest El Niño seasons go the other way: 1982-83, 1997-98 and 2015-16 were all wetter than average. // 2015-16 was the wettest of all 44.

Temperature rises over almost the whole country: on 84% of it, at least 0.5 °C more. // In grey, no El Niño effect stands out.

For rain, the country splits: drier in the north, wetter in the far south. In between, El Niño changes nothing measurable. // Heat is the firmer signal: on 47% of the country, this El Niño changes the temperature measurably, but not the rain.

And it is not only south-east Pará. The delay reaches 18 days in the Atlantic Forest, 13 in the Northeast and 7 in the Cerrado.