El Niño 2026-27 by region of Brazil
2026-27 rainy season
The darker the shade, the stronger the warming or the loss of rain
Explore a location
Updated 12 November 2026
What the map shows
These four maps apply the national El Niño 2026-27 analysis to Pará, Minas Gerais, Mato Grosso do Sul and the Pantanal, with each one's towns and mesoregions. In Pará, almost the whole state leans towards a hotter and drier rainy season. In the Pantanal, the north leans hotter, and much of the south has no measurable link with El Niño. We made these zooms because a national picture hides differences that show at the scale of a region.
How we built it
We cut the national El Niño 2026-27 map into four regions without changing the calculation: the middle scenario of 100,000 simulated seasons, compared with seasonal normals. In each zoom, the darker the shade, the stronger the warming or the change in rain. We added the main towns and IBGE boundaries to make the maps easier to read.
What the map does not say
- The same limits as the national map apply: the middle scenario of 100,000 simulated seasons, and uncoloured places where the link with El Niño is not measurable.
- Only four regions are done so far. For other places, the El Niño Explorer gives the same result.
- The zoom enlarges the map, not its resolution: the data are still in regions of about 28 km.
How strong this El Niño is
An El Niño is very strong when the sea surface temperature in the central Pacific reaches 2 °C above normal at its peak. Since 1981, only three have got there: 1982-83, 1997-98 and 2015-16. NOAA puts at 100% the chance that this year's is very strong from October to December, and at about 60% the chance that it reaches +2.5 °C or more from October to December and from November to January, which would exceed every El Niño on record since 1950. For December to February, NOAA gives very strong 79%, strong 19% and moderate 2%.
How far to trust each colour
Each colour is the most likely result, the middle scenario, of 100,000 seasons simulated from NOAA's odds. We colour only the places where the link with El Niño, measured over 44 years of data, is measurable. Where that link is weak or absent, the map is left uncoloured and gives no figure. The El Niño Explorer shows, for each place, the range where 8 in 10 simulated seasons fall.
We rerun this analysis after each monthly NOAA update, and the El Niño Explorer gives the detail place by place.
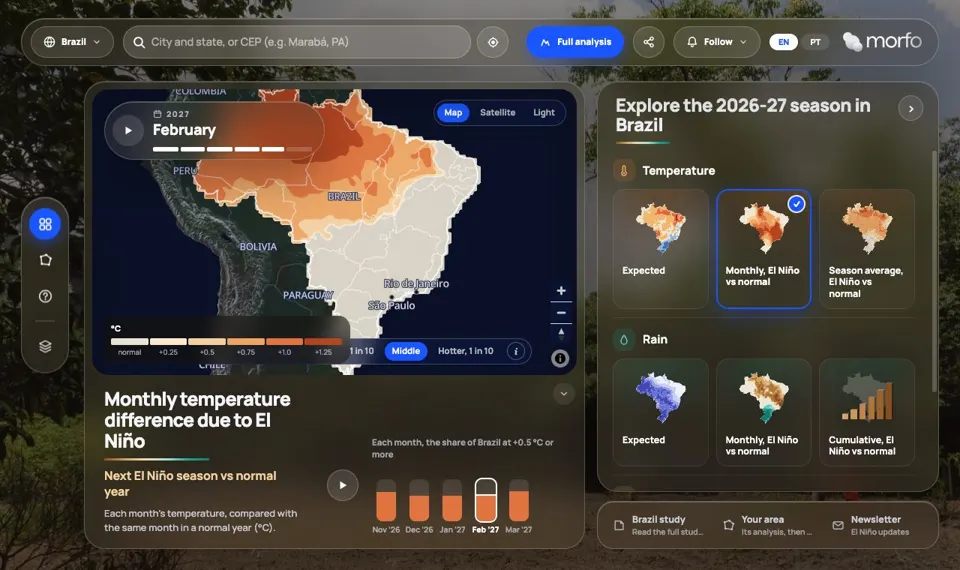
El Niño Explorer
Rain and temperature in the coming rainy season, region by region, from 44 years of data.
How we use this data to analyse an area
On an area
How rain and temperature react to El Niño is one of the 21 criteria MORFO combines to assess an area. These zooms give the regional context, and in the MORFO Ri pre-analysis we compute that link for the area itself. For any other region, the El Niño Explorer shows the same result place by place.
What MORFO does next
- Prescribes what to plant, at what density and with what soil preparation.
- Organises the seeds.
- Plants with our field partners.
- Measures the results over the years in MORFO Ri.
The data
NOAA CPC, monthly probabilities of El Niño strength; CHIRPS, monthly rain 1981-2025, about 5 km; ERA5-Land, temperature, about 9 km; 100,000 simulated seasons per region of about 28 km; mesoregions, states and biomes: IBGE. MORFO analysis. See the sources
MORFO scientific team · Version 1, updated November 2026
Related maps
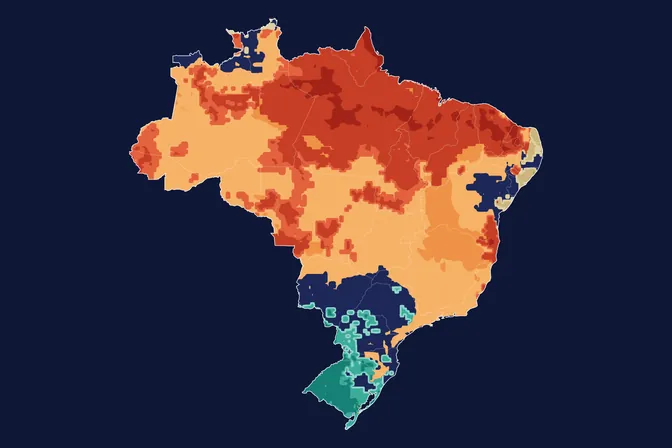 Where El Niño may hit Brazil in the 2026-27 season
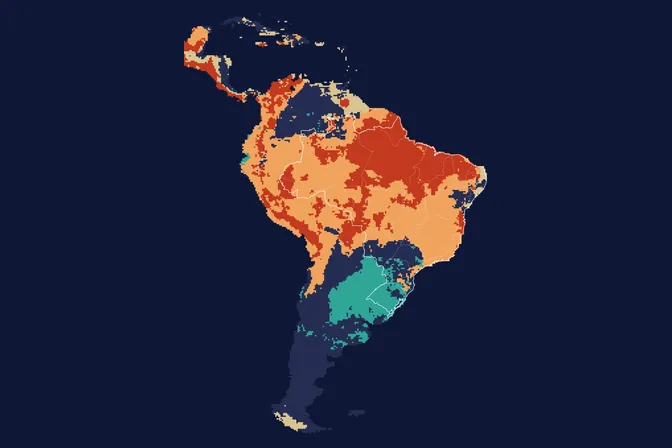 El Niño 2026-27 in South America: where it gets hotter and drier
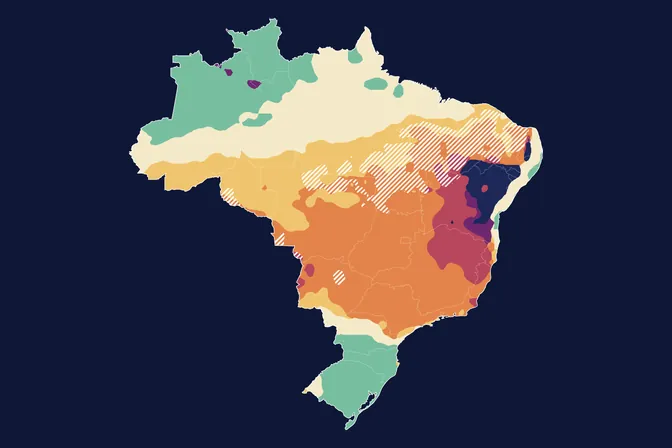 Until when rain still favours planting in 2026-27, with El Niño
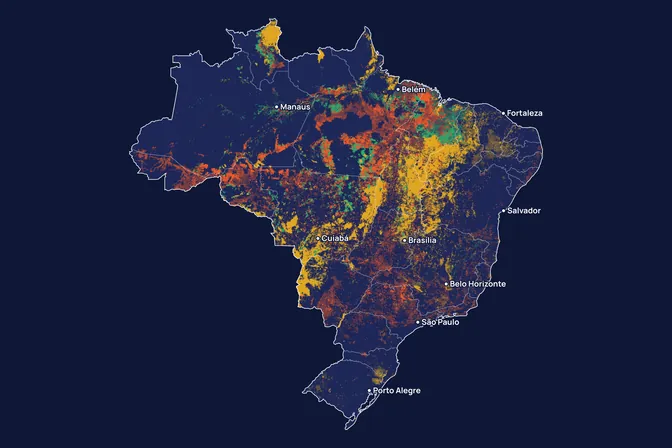 Where fire appears in Brazil, and what it burns
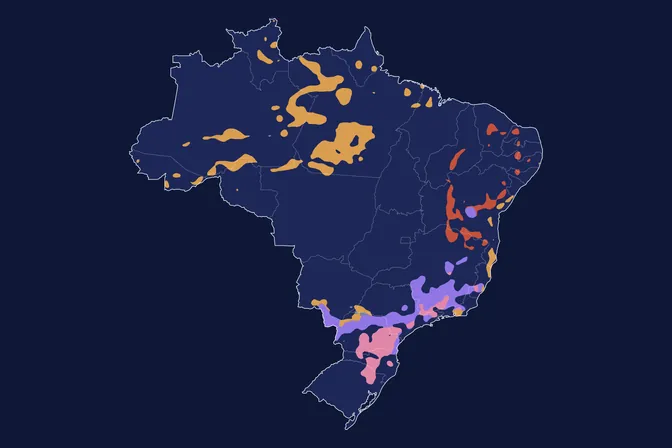 Where Brazil's climate type could change by 2070
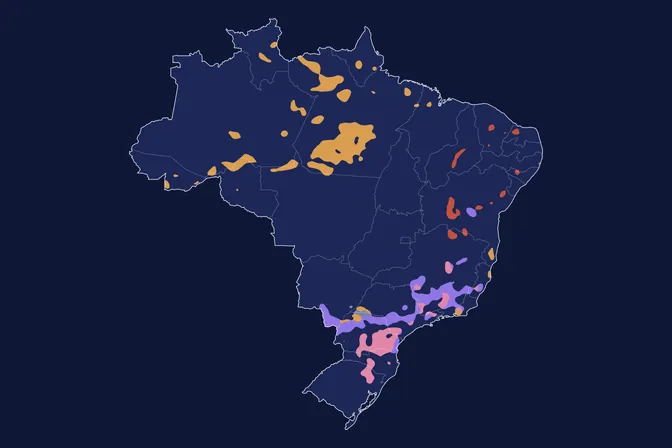 By 2100, how much Brazil's climate changes depends on emissions
How to cite
MORFO Data. El Niño 2026-27 by region of Brazil. MORFO scientific team, version 1, November 12, 2026. Available at: https://www.morfo.rest/resources/data/el-nino-four-regions
CC BY 4.0 licence: reproduce with this citation and a link to the page. Source data keep the licence of each source.
Want this analysis for your area?
- Send your areaLocation, polygon or CAR number.
- Talk with the teamTo understand the project.
- Pre-analysis of the areaBlockers, operable area, site score and first methods.
MORFO Restoration Intelligence is the platform where each area's pre-analysis, plan and follow-up come together. See MORFO Ri
Your area
LET'S GROW with MORFO