El Niño 2026-27: 934 million hectares likely to be hotter and drier at the same time
Luisa Ritzmann Peceniski · 2026-11-02 · 6 minutes
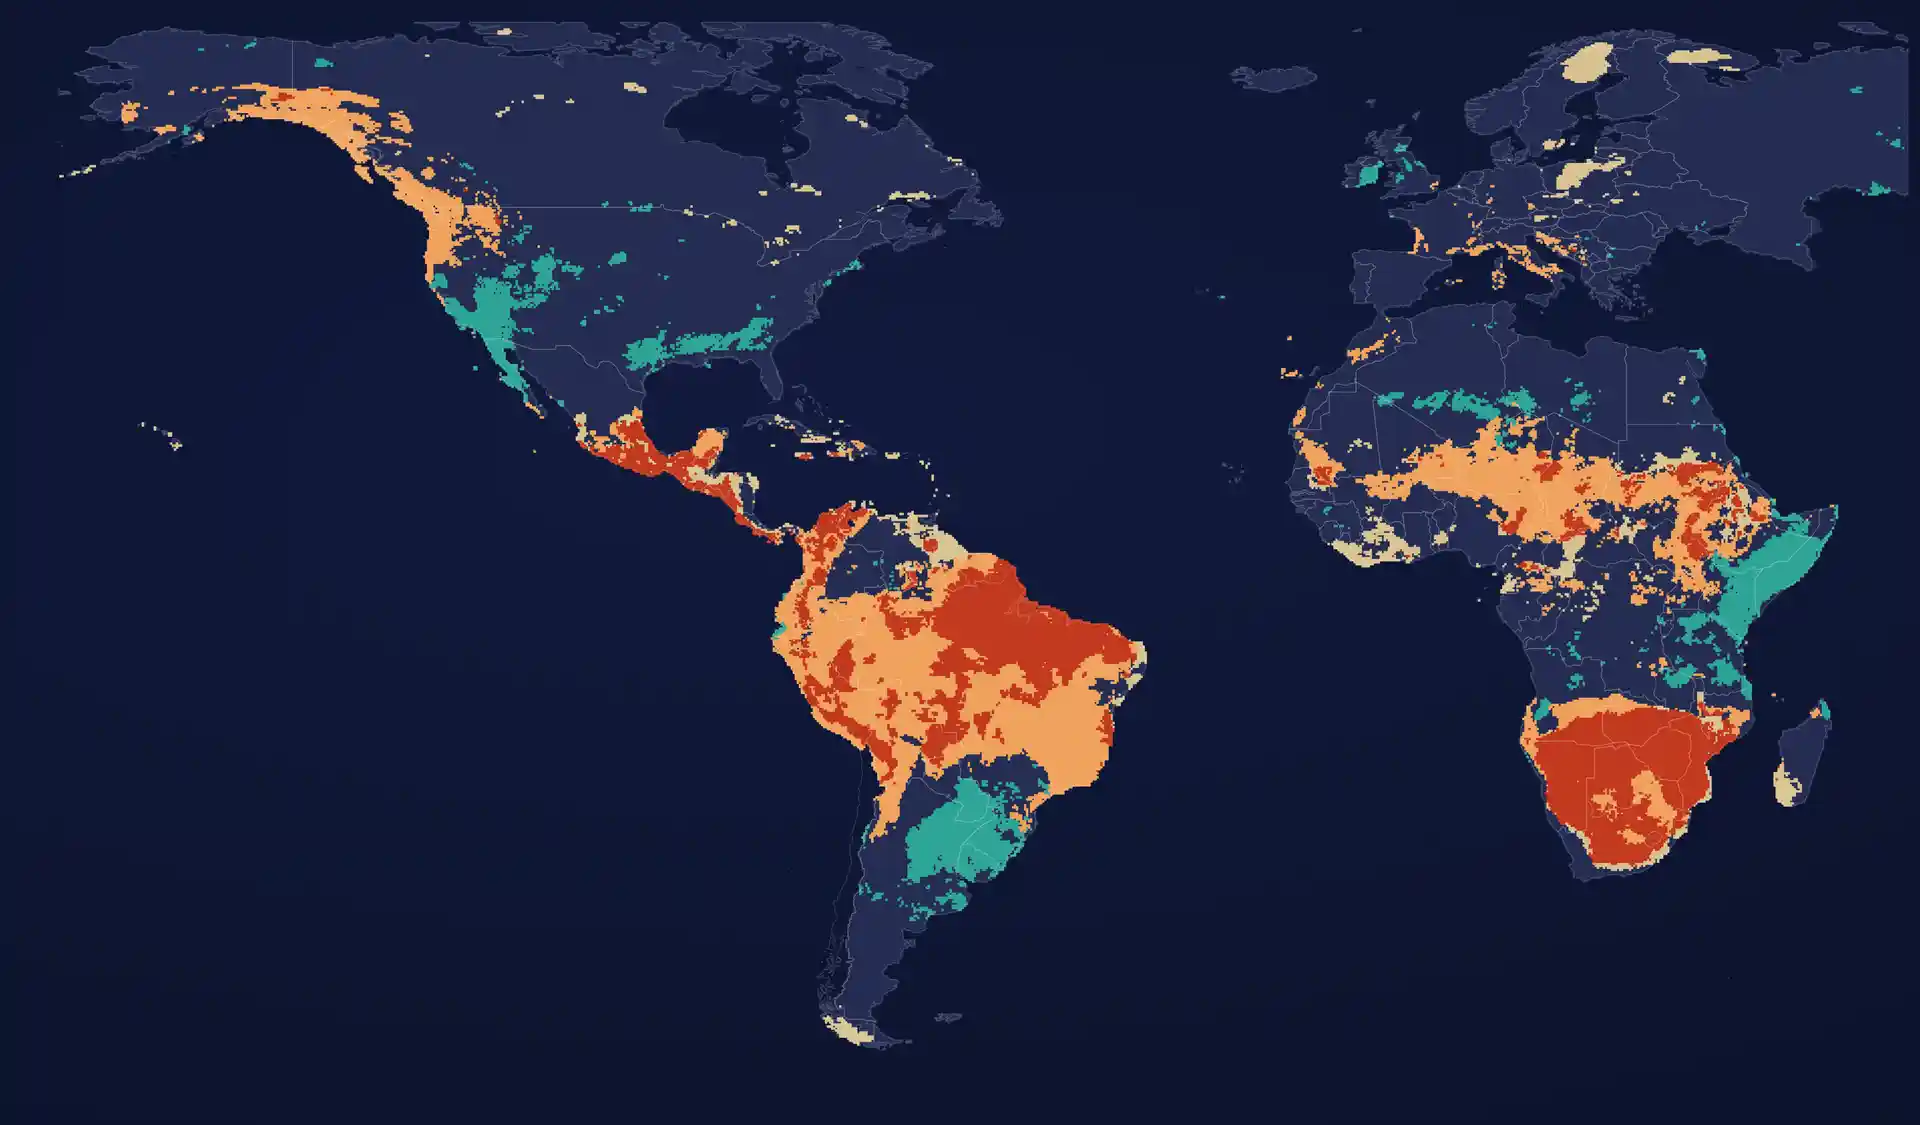
NOAA's Climate Prediction Center gives a 100% chance of a very strong El Niño from October to December 2026, and an 83% chance that it reaches +2.5 °C or more over those three months. That would exceed every El Niño on record since 1950. The probabilities are unusually firm for a climate signal. What they mean on the ground is much less uniform.
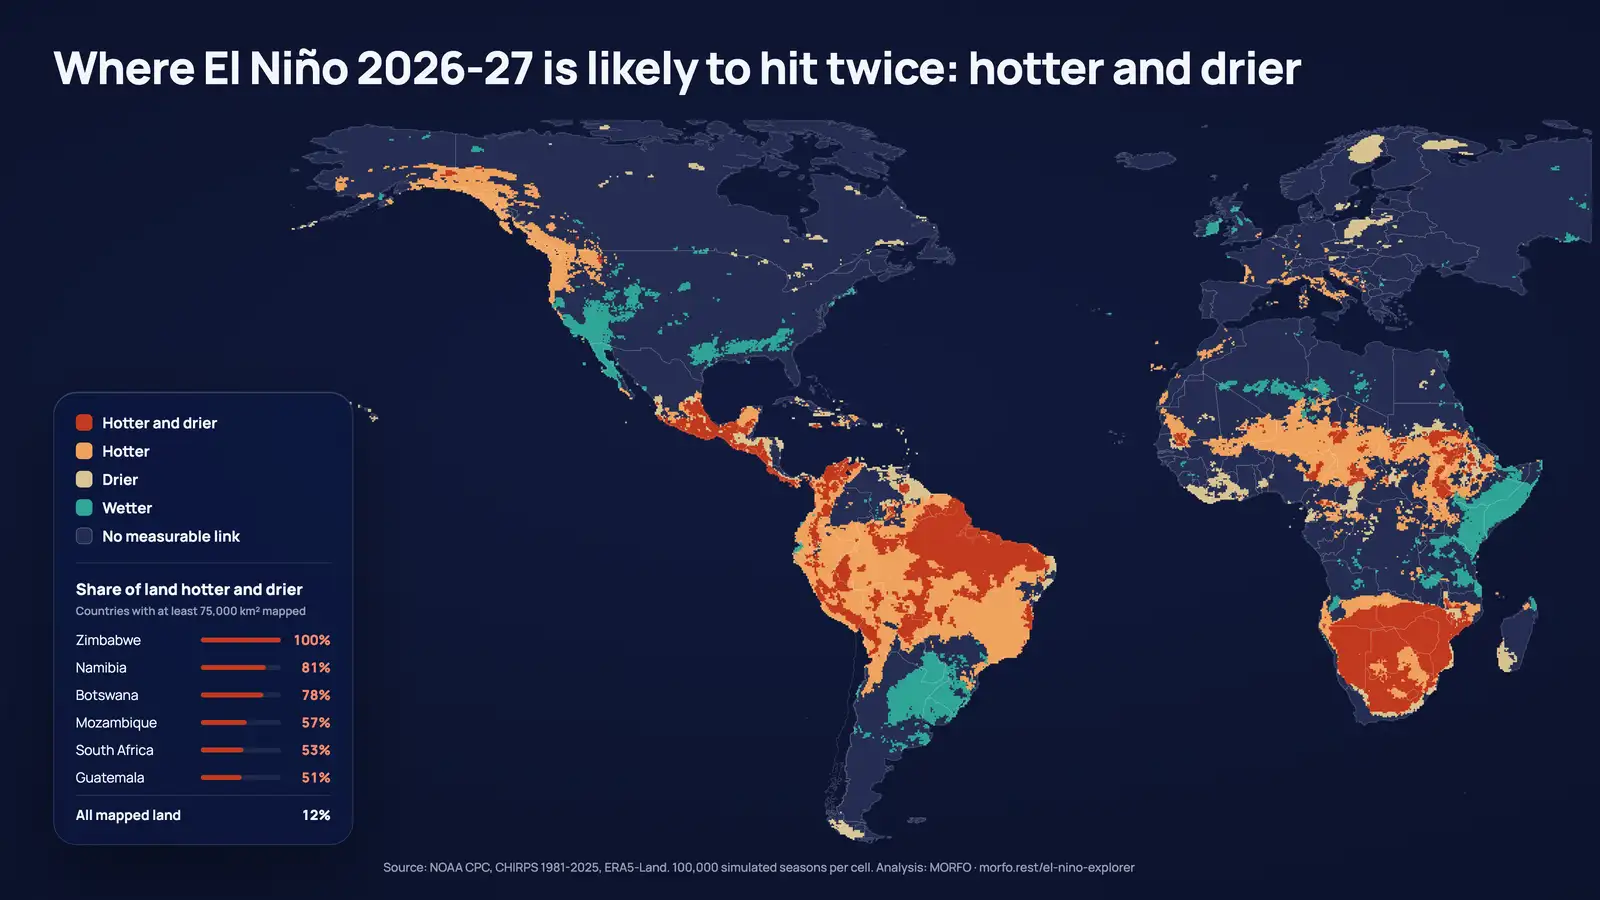
We mapped the likely effect of El Niño on the coming rainy season across the Americas, Europe and Africa, 28 km by 28 km, over 8.1 billion hectares of land. On 43% of that land, the season shows a measurable link with El Niño, in temperature, in rain or in both. On 934 million hectares, an area larger than the contiguous United States, the season is likely to be at least 0.5 °C warmer and drier at the same time. This article sets out where, and where the same event pushes the other way.
Southern Africa is hit twice
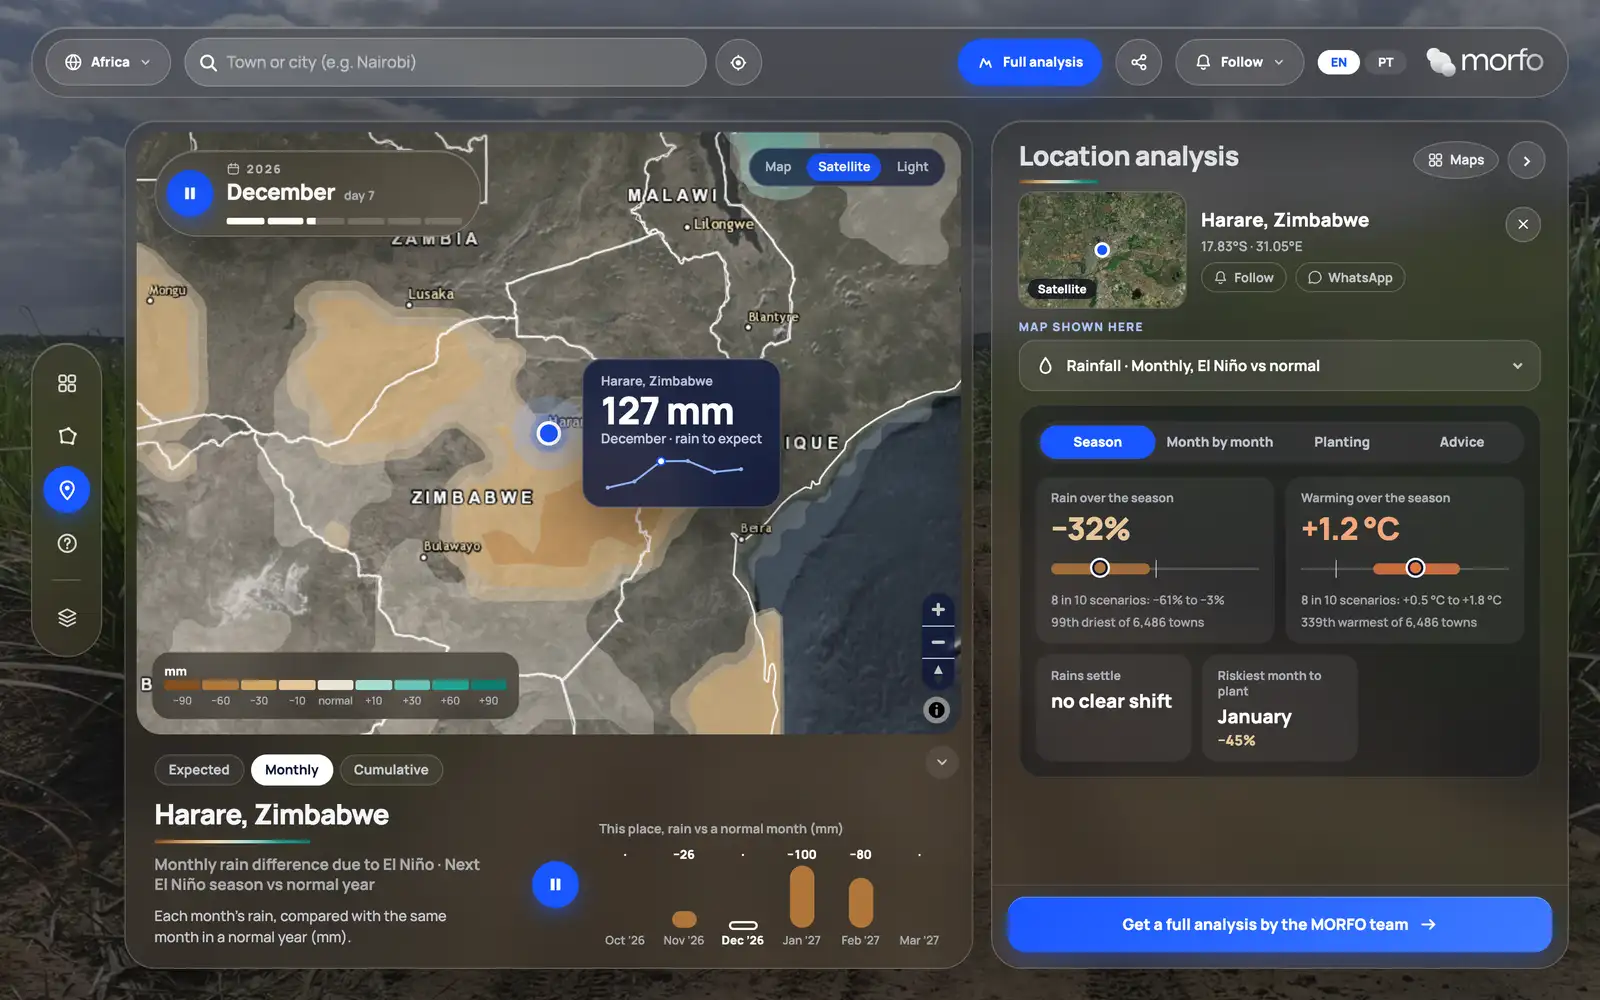
In Zimbabwe, 97% of the country is likely to be at least 1 °C warmer, and almost all of it could lose 20% or more of its rainy-season rain. Harare could lose 32% of its rain and gain 1.2 °C. Lusaka could lose 24%.
The overlap of heat and drought extends across the region. Namibia (83% of its land), Botswana (78%) and South Africa (55%) are likely to be hotter and drier at the same time. In Botswana, the whole country is likely to be at least 1 °C warmer.
The northern Andes, Central America and the Caribbean dry out
- Peru: 98% of the land is likely to be at least 0.5 °C warmer. Arequipa could lose 35% of its rain with 1.4 °C more.
- Colombia's Caribbean coast: Barranquilla and Santa Marta could lose a third of their rain.
- Central America: 41% of Honduras and 35% of Nicaragua could lose 20% or more of their rain. Managua could lose 31%, Guatemala City 17%.
- The Caribbean: Kingston could lose 35%.
- Mexico: 42 million hectares are likely to be hotter and drier, including Puebla, with 23% less rain.
Brazil holds a third of the hotter-and-drier land
Brazil is the largest single block: 327 million hectares, 35% of all the hotter-and-drier land mapped. In 93% of the country, the season shows a measurable link with El Niño, and 37% of the territory is likely to be hotter and drier at the same time. The country splits at about 23°S, drier to the north and wetter to the south. We detail the Brazilian results, region by region, in our article on Brazil's rainy season.
Other regions lean wetter
The same event pushes some regions the opposite way:
- East Africa: two thirds of Kenya leans wetter, with about 40% more rain in Nairobi and 34% in Mombasa.
- The Río de la Plata basin: 77% of Uruguay and 46% of Paraguay lean wetter, with Asunción at 42% more rain.
- The southwestern United States: Los Angeles could get 56% more rain and San Diego 49%.
More rain is not good news by default. For a planting project, it can mean waterlogged soil, machinery that cannot reach the plots and erosion on bare ground.
Europe sits mostly outside the signal
The data show a measurable link with El Niño on only 6% of Europe this season. For most European sites, the coming season will be driven by other factors.
How the analysis was built, and what it leaves out
The land was divided into 136,397 cells of about 28 km. For each cell, rain and temperature in every rainy season since 1981 were compared with El Niño's strength, which gives 44 seasons of record. Each cell's rainy season is its five wettest months. The coming season was then simulated 100,000 times per cell, drawing El Niño's strength from the probabilities NOAA published on 8 October 2026. Sources: CHIRPS (Climate Hazards Center, UC Santa Barbara) for rain, ERA5-Land (ECMWF and Copernicus) for temperature, and NOAA's ONI index.
A cell only counts where the link between El Niño and local rain or temperature is clear or moderate. Where it is weak or absent, the analysis says so instead of filling the gap. That is why 57% of the land mapped shows no measurable link.
What the analysis does not say:
- Every number is the most likely value, with a range around it. None of it is a weather forecast for a given day.
- It covers climate only, not crop yields, prices or fire risk.
- It does not cover Asia or Oceania, where El Niño also weighs heavily.
- It uses NOAA's 8 October bulletin. The next one is due on 12 November.
Why a restoration company mapped three continents
A seedling lives on the rain of its first three months. When that rain arrives late, or arrives with more heat, the planting date, the species mix and the replanting budget all change. We built the analysis for our own projects in three biomes in Brazil, and opened it in the El Niño Explorer so that anyone who plants can search a town and see, month by month, the temperature and rain to expect, how late the rains could start and which planting month is the riskiest.
The map does not tell anyone whether to plant. It tells them which season they are planting into, and that is the information most planting calendars are still built without.