62 million people live today where the climate type could change by 2100
What changes in the climate by 2100
- Dry winter
- No cold month
- Hotter summers
- Humid all year
- Drier
- Other
- Same as today
1 dot = 4,000 people (2020 population). Middle scenario, 2071 to 2099.
What the map shows
Under the middle emissions scenario, 62 million people live today where the climate type changes by 2071-2099, 29% of the population. Depending on emissions, that number ranges from 33 to 84 million. São Paulo state, Paraná and the northeast coast hold many of these people, and 34.9 million of them end up in a tropical climate with a dry season. We made this map to turn an abstract climate map into people.
How we built it
We crossed WorldPop's 2020 population with the 1 km cells where the Köppen climate type changes between 1991-2020 and 2071-2099. On the map, each dot is 4,000 people and lights up in the colour of the change, for example a dry winter or hotter summers. We ran the calculation for the three emissions scenarios: 33 million under the low one, 62 million under the middle one and 84 million under the very high one. The animation moves through each type of change, one after another.
What the map does not say
- 62 million is today's population (2020) in those places. It is not an estimate of the population in 2100.
- The result depends heavily on the scenario: from 33 to 84 million people, from the lowest to the highest emissions.
- A change of Köppen class is a threshold crossing, for example the coldest month with a temperature above 18 °C. It does not predict a specific impact: São Paulo and Curitiba sit just below that threshold today.
- WorldPop population is modelled and sits about 5% above the 2022 Census.
How we use this data to analyse an area
On an area
This map does not feed directly into the analysis of an area. It gives a picture of who lives where the climate changes. For the horizon of a restoration project, we use the 2070 climate map, which matches the future climate criterion, one of the 21 MORFO combines to assess an area.
What MORFO does next
- Prescribes what to plant, at what density and with what soil preparation.
- Organises the seeds.
- Plants with our field partners.
- Measures the results over the years in MORFO Ri.
The data
Beck et al. 2023, Köppen climate classes at 1 km, 1991-2020 and 2071-2099, low, middle and very high emissions scenarios; WorldPop, people per 1 km cell, 2020. MORFO analysis. See the sources
MORFO scientific team · Version 1, updated November 2026
Related maps
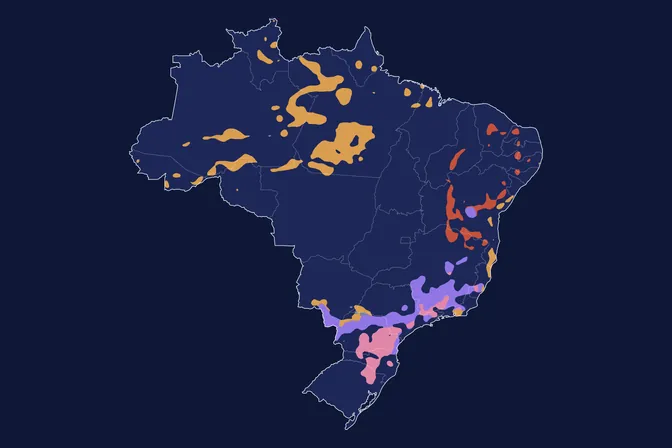 Where Brazil's climate type could change by 2070
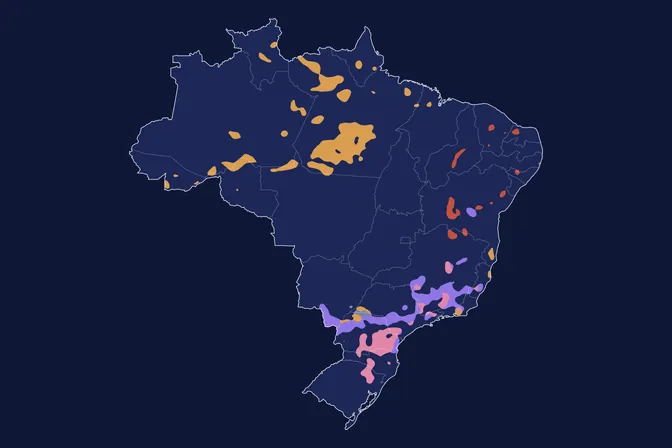 By 2100, how much Brazil's climate changes depends on emissions
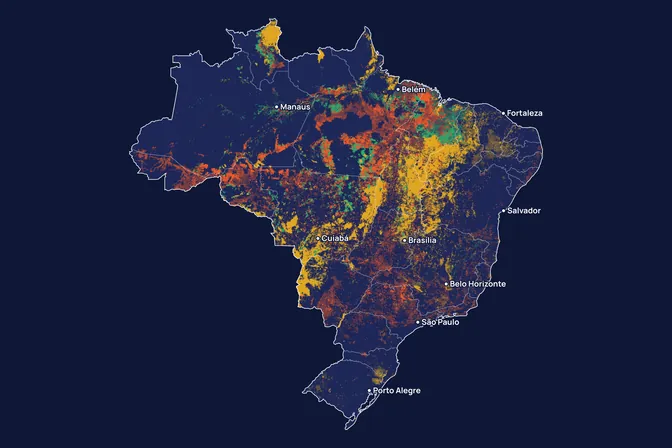 Where fire appears in Brazil, and what it burns
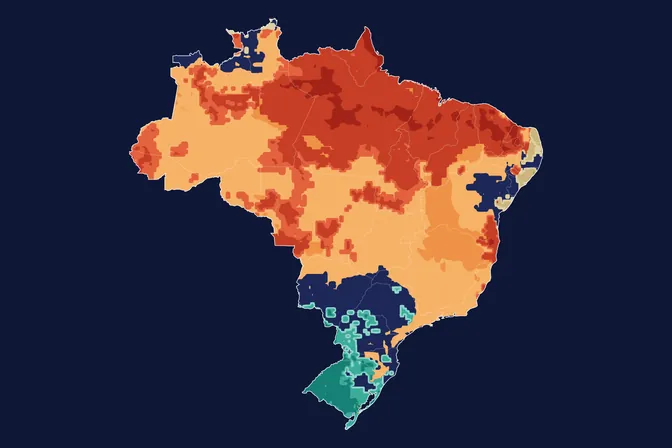 Where El Niño may hit Brazil in the 2026-27 season
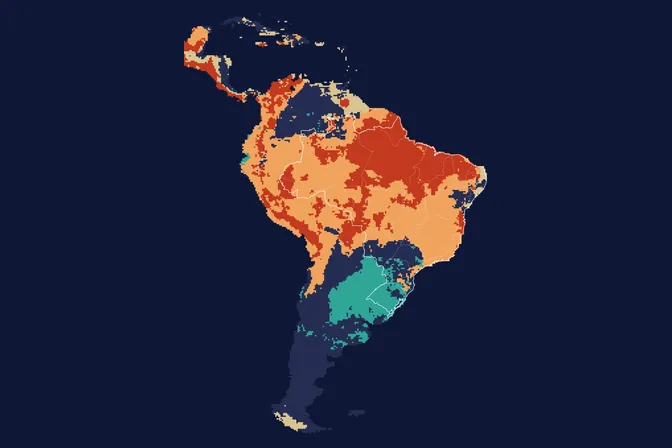 El Niño 2026-27 in South America: where it gets hotter and drier
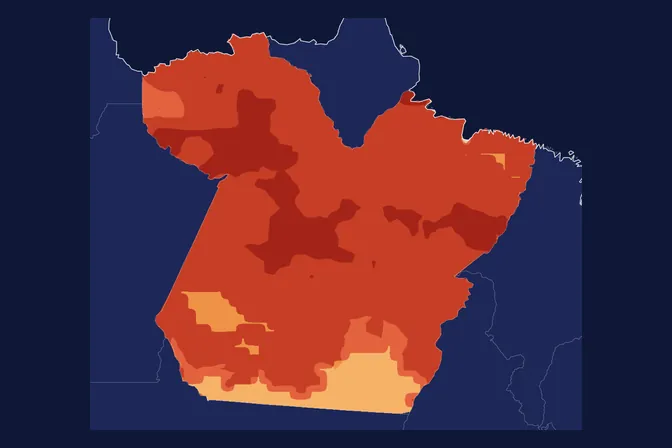 El Niño 2026-27 by region of Brazil
How to cite
MORFO Data. 62 million people live today where the climate type could change by 2100. MORFO scientific team, version 1, November 14, 2026. Available at: https://www.morfo.rest/resources/data/climate-and-people
CC BY 4.0 licence: reproduce with this citation and a link to the page. Source data keep the licence of each source.
Want this analysis for your area?
- Send your areaLocation, polygon or CAR number.
- Talk with the teamTo understand the project.
- Pre-analysis of the areaBlockers, operable area, site score and first methods.
MORFO Restoration Intelligence is the platform where each area's pre-analysis, plan and follow-up come together. See MORFO Ri
Your area
LET'S GROW with MORFO