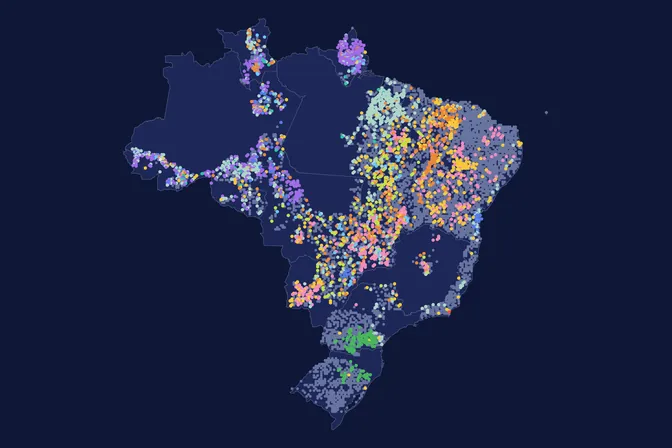
The well-known tree that marks each region
Typical known tree of each cell
Each cell shows the tree whose records are most concentrated there, within the area where it is native.
Explore a location
What the map shows
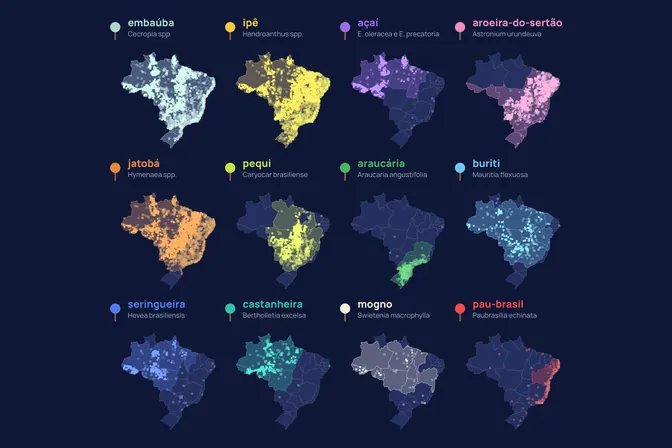
Some trees travelled with people: 34% of pau-brasil records and 24% of seringueira records fall outside the states where they are native. Ipê and embaúba, native to all 27 states, have no records outside their range. This map cuts Brazil into cells and shows, in each one, the well-known tree most typical of it, using only records inside each tree's native range. We made this map to show where each species is actually recorded, beyond where botanists list it as native.
How we built it
We gathered the records of the 12 trees from forest inventories, herbaria and observations, and kept only those inside the states where each tree is native. We cut Brazil into cells and, in each one, compared how concentrated each tree's records are there relative to its whole range. The cell shows the tree with the highest concentration, and cells with too few records take the tree of the nearest cell. In the animation, the camera travels through the country's five regions on a finer grid.
What the map does not say
- Each cell shows the most typical tree there, not the most numerous. The calculation dampens the weight of rare trees.
- The map is built from records, so it also reflects where people collect and observe.
- Only records inside each tree's native states are used. Trees planted outside those states do not appear.
- The map compares only 12 well-known trees. Each cell holds many other species.
How we use this data to analyse an area
On an area
The reference ecosystem and species are one of the 21 criteria MORFO combines to assess an area. This map is a first filter: it shows which well-known trees are actually recorded in each region. It compares only 12 species and does not say what to plant on an area. In the MORFO Ri pre-analysis, the species list starts from the original vegetation and occurrence records near the area itself.
What MORFO does next
- Prescribes what to plant, at what density and with what soil preparation.
- Organises the seeds.
- Plants with our field partners.
- Measures the results over the years in MORFO Ri.
The data
National Forest Inventory, plots from 2011 to 2024; Amazon tree inventories (ORNL), 2009 to 2018; GBIF.org, records from 2000 to 2026; speciesLink, herbarium records since 2000, licence varies by institution. MORFO analysis. See the sources
MORFO scientific team · Version 1, updated November 2026
Related maps
How to cite
MORFO Data. The well-known tree that marks each region. MORFO scientific team, version 1, November 14, 2026. Available at: https://www.morfo.rest/resources/data/known-trees-by-region
CC BY 4.0 licence: reproduce with this citation and a link to the page. Source data keep the licence of each source.
Want this analysis for your area?
- Send your areaLocation, polygon or CAR number.
- Talk with the teamTo understand the project.
- Pre-analysis of the areaBlockers, operable area, site score and first methods.
MORFO Restoration Intelligence is the platform where each area's pre-analysis, plan and follow-up come together. See MORFO Ri
Your area
LET'S GROW with MORFO