Brazil resized by native vegetation that grew back and by restoration potential
Native vegetation grown back, million ha (2024)
- Less than 0.5
- 0.5 to 1
- 1 to 2
- 2 to 3
- More than 3
What the map shows
Brazil changes shape three times on this map. First, each state takes the size of its native vegetation that grew back, 34.8 million hectares nationwide in 2024, and Bahia and Minas Gerais swell. Second, only forest that grew back and has stood for 10 years or more counts, 10.2 million hectares, and Pará leads. Third, each state takes the size of its pasture, 166.5 million hectares in 2025, with Minas Gerais and Pará ahead. We made this map to show in one shape where nature is already coming back and where there is room to restore.
How we built it
A cartogram is a map in which each state's area is proportional to a figure instead of its real surface. We drew three cartograms: native vegetation that grew back (MapBiomas, 2024 data), forest that grew back and is 10 years or older (YBYRÁ-BR, which dates each secondary forest) and all pasture mapped by MapBiomas in 2025, which we use as restoration potential. The first cartogram uses the 2024 data: this is why it adds up to 34.8 million hectares, and not the 33.4 million of 2025 on the native regrowth map.
What the map does not say
- Restoration potential is all pasture mapped by MapBiomas. Not all of it is degraded, available or for sale.
- Regrown vegetation includes abandoned land, and part of it is cleared again later.
- The three maps use different sources and years (MapBiomas collections 10 and 11, YBYRÁ-BR), so their values do not add up or compare directly.
- YBYRÁ-BR dates forests only. Savanna that grew back is not in the second map.
How we use this data to analyse an area
On an area
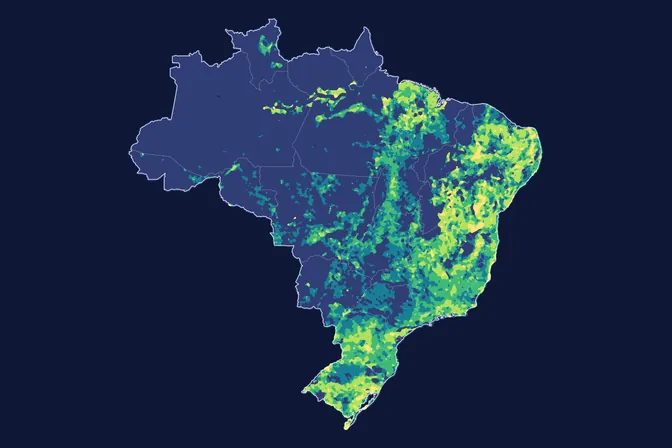
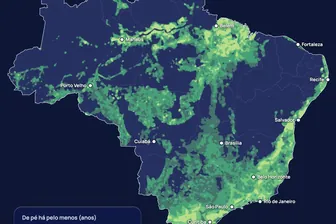
This map gives a general picture by state and does not feed directly into the assessment of an area. For an actual area, land cover, land-use history and the chance of natural regrowth are among the 21 criteria MORFO combines: in the MORFO Ri pre-analysis, we look at what grows on the area itself and how much native vegetation surrounds it. The map where native vegetation has grown back shows the same thing on a 5 km grid.
What MORFO does next
- Prescribes what to plant, at what density and with what soil preparation.
- Organises the seeds.
- Plants with our field partners.
- Measures the results over the years in MORFO Ri.
The data
MapBiomas secondary vegetation and land cover and land use, collections 10 and 11, 30 m (regrown vegetation in 2024, pasture in 2025); YBYRÁ-BR, age of secondary forests, 30 m, 1986 to 2024, peer-reviewed. MORFO analysis. See the sources
MORFO scientific team · Version 1, updated November 2026
Related maps
How to cite
MORFO Data. Brazil resized by native vegetation that grew back and by restoration potential. MORFO scientific team, version 1, November 12, 2026. Available at: https://www.morfo.rest/resources/data/regrowth-cartogram
CC BY 4.0 licence: reproduce with this citation and a link to the page. Source data keep the licence of each source.
Want this analysis for your area?
- Send your areaLocation, polygon or CAR number.
- Talk with the teamTo understand the project.
- Pre-analysis of the areaBlockers, operable area, site score and first methods.
MORFO Restoration Intelligence is the platform where each area's pre-analysis, plan and follow-up come together. See MORFO Ri
Your area
LET'S GROW with MORFO