How much carbon restoration captures per year
tCO2 per hectare per year
Explore a location
What the map shows
On average, natural regrowth in Brazil stores 14.6 tonnes of CO2 per hectare per year aboveground, over its first 30 years. The Amazon leads with 17.6 tonnes, ahead of the Atlantic Forest (13.0) and the Cerrado (12.6); in the Caatinga (8.8) and the Pampa (6.9), carbon builds up more slowly. We made this map to show where faster growth can mean more carbon per hectare. The values sit at the upper end of field estimates.
How we built it
We used the global map by Cook-Patton et al. (2020), which estimates how much carbon natural regrowth stores per hectare per year over its first 30 years, on a 1 km grid. We show the value in tonnes of CO2, aboveground biomass only, and computed the mean for Brazil and for each biome.
What the map does not say
- The map counts aboveground biomass only. Roots would add roughly 22 to 38%.
- The values describe natural regrowth, not planting.
- The values sit at the upper end of field estimates: in the Amazon, 1.6 to 3.7 times those of Heinrich et al. 2021.
- The map does not yet include a more conservative layer for comparison, such as IPCC default values.
How we use this data to analyse an area
On an area
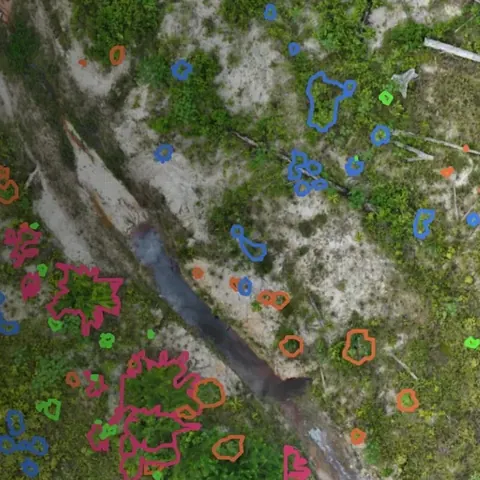
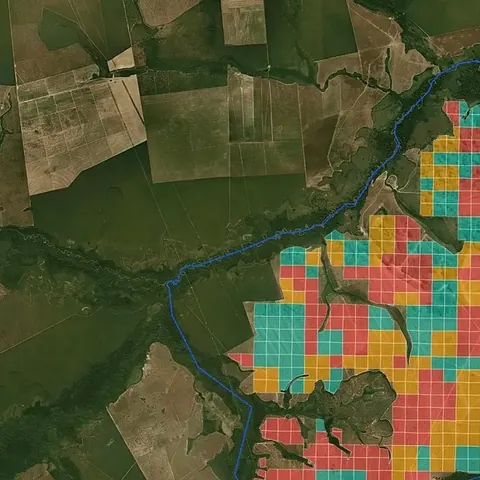
The priority simulator uses this layer as one of its national criteria, to compare regions. On an actual area, carbon depends on the method chosen and is measured in the field, in the plots MORFO follows over the years in MORFO Ri. For a carbon project, the first filter is the restrictions map.
What MORFO does next
- Prescribes what to plant, at what density and with what soil preparation.
- Organises the seeds.
- Plants with our field partners.
- Measures the results over the years in MORFO Ri.
The data
Cook-Patton et al. 2020, carbon accumulation in natural regrowth over the first 30 years, 1 km, Global Forest Watch, CC BY 4.0 licence. MORFO analysis. See the sources
MORFO scientific team · Version 1, updated November 2026
Related maps
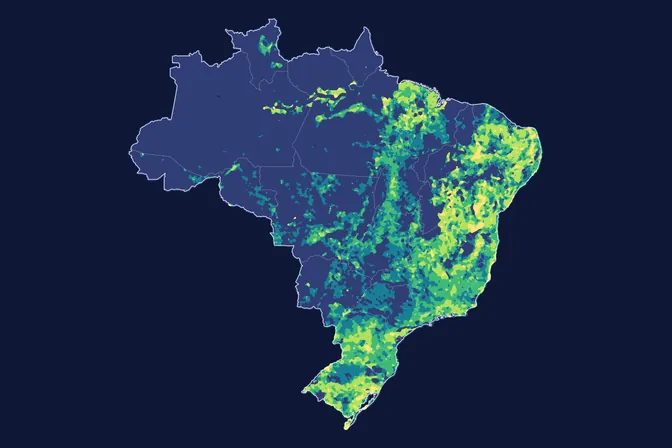 Where native vegetation has grown back in Brazil
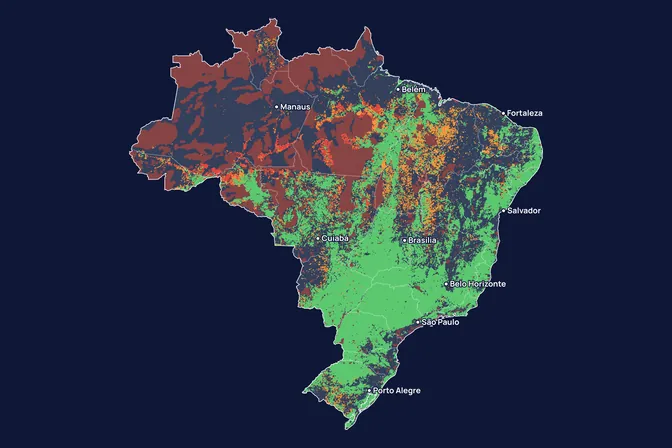 Where a restoration project meets fewer restrictions
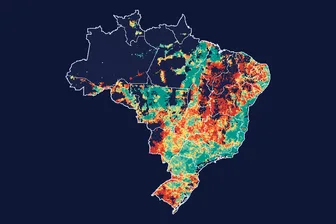 Priority simulator
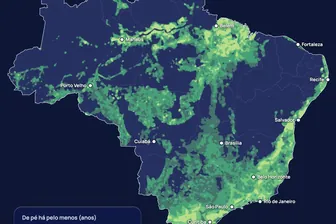 Regrown forests still standing after 5, 10, 20 and 30 years
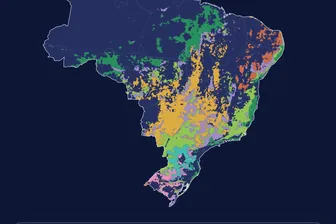 What was there before, where there is now pasture, cropland and cities
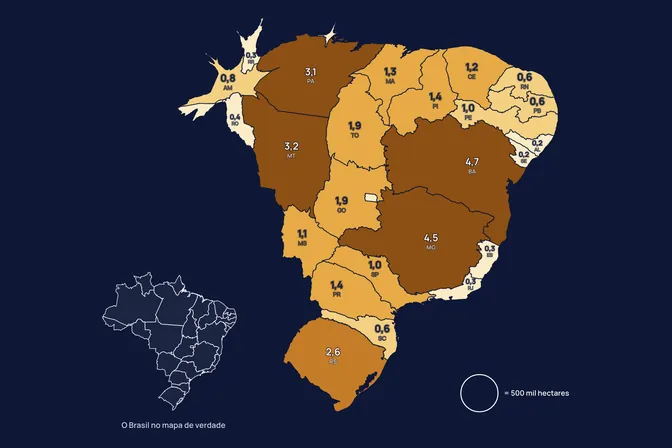 Brazil resized by native vegetation that grew back and by restoration potential
How to cite
MORFO Data. How much carbon restoration captures per year. MORFO scientific team, version 1, November 14, 2026. Available at: https://www.morfo.rest/resources/data/carbon-regrowth
CC BY 4.0 licence: reproduce with this citation and a link to the page. Source data keep the licence of each source.
Want this analysis for your area?
- Send your areaLocation, polygon or CAR number.
- Talk with the teamTo understand the project.
- Pre-analysis of the areaBlockers, operable area, site score and first methods.
MORFO Restoration Intelligence is the platform where each area's pre-analysis, plan and follow-up come together. See MORFO Ri
Your area
LET'S GROW with MORFO