What was there before, where there is now pasture, cropland and cities
Original vegetation, according to IBGE
Explore a location
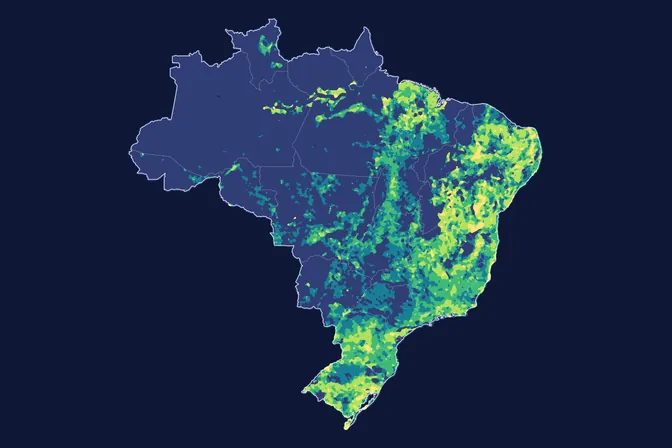
What the map shows
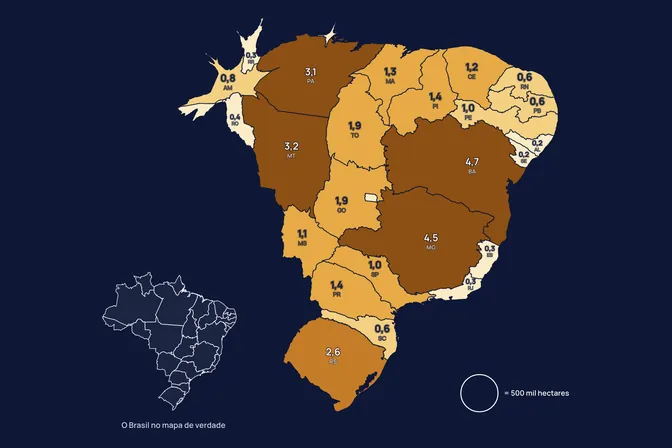
Of the 277.7 million hectares Brazil now uses for pasture, crops and cities, 101.9 million were in savanna, caatinga or grassland regions, according to IBGE. These regions also include forest formations. Another 119.8 million hectares were forest, and the Cerrado alone accounts for 74.0 million. We made this map because restoring in the Cerrado, the Caatinga or the Pampa means, on much of the land, bringing back open vegetation with fewer trees than a forest.
How we built it
IBGE's vegetation map says which vegetation grew in each place before clearing. MapBiomas says, at 30 m, what covers the land today, in every biome. We selected the land MapBiomas shows as pasture, cropland or city in 2025 and read the original vegetation of each piece in the IBGE map. Native vegetation still standing, including vegetation that grew back and remnants inside farmland, is left out.
What the map does not say
- Vegetation that grew back counts as native here, even when it is young. Part of it may be cleared again.
- MapBiomas tells native grassland apart from planted pasture with its own classification, which has a margin of error, mainly in the Pampa and the Pantanal.
- IBGE and MapBiomas work at different scales (1:250,000 and 30 m). Totals therefore differ from IBGE's own figures, which show 344 million hectares under human use.
- IBGE mapping dates vary from one map sheet to another.
How we use this data to analyse an area
On an area
The reference ecosystem is one of the 21 criteria MORFO combines to assess an area. In the MORFO Ri pre-analysis, the area's original vegetation guides what restoration should bring back, the choice of species and the method. This map shows that starting point at national scale, and the diagnostic checks in the field what remains of the original vegetation.
What MORFO does next
- Prescribes what to plant, at what density and with what soil preparation.
- Organises the seeds.
- Plants with our field partners.
- Measures the results over the years in MORFO Ri.
The data
IBGE vegetation map at 1:250,000, 2026; MapBiomas land cover and land use, collection 11, 2025, 30 m. MORFO analysis. See the sources
MORFO scientific team · Version 2, updated November 2026
Related maps
How to cite
MORFO Data. What was there before, where there is now pasture, cropland and cities. MORFO scientific team, version 2, November 17, 2026. Available at: https://www.morfo.rest/resources/data/what-grew-before
CC BY 4.0 licence: reproduce with this citation and a link to the page. Source data keep the licence of each source.
Want this analysis for your area?
- Send your areaLocation, polygon or CAR number.
- Talk with the teamTo understand the project.
- Pre-analysis of the areaBlockers, operable area, site score and first methods.
MORFO Restoration Intelligence is the platform where each area's pre-analysis, plan and follow-up come together. See MORFO Ri
Your area
LET'S GROW with MORFO